What Is the Bid–Ask Spread?
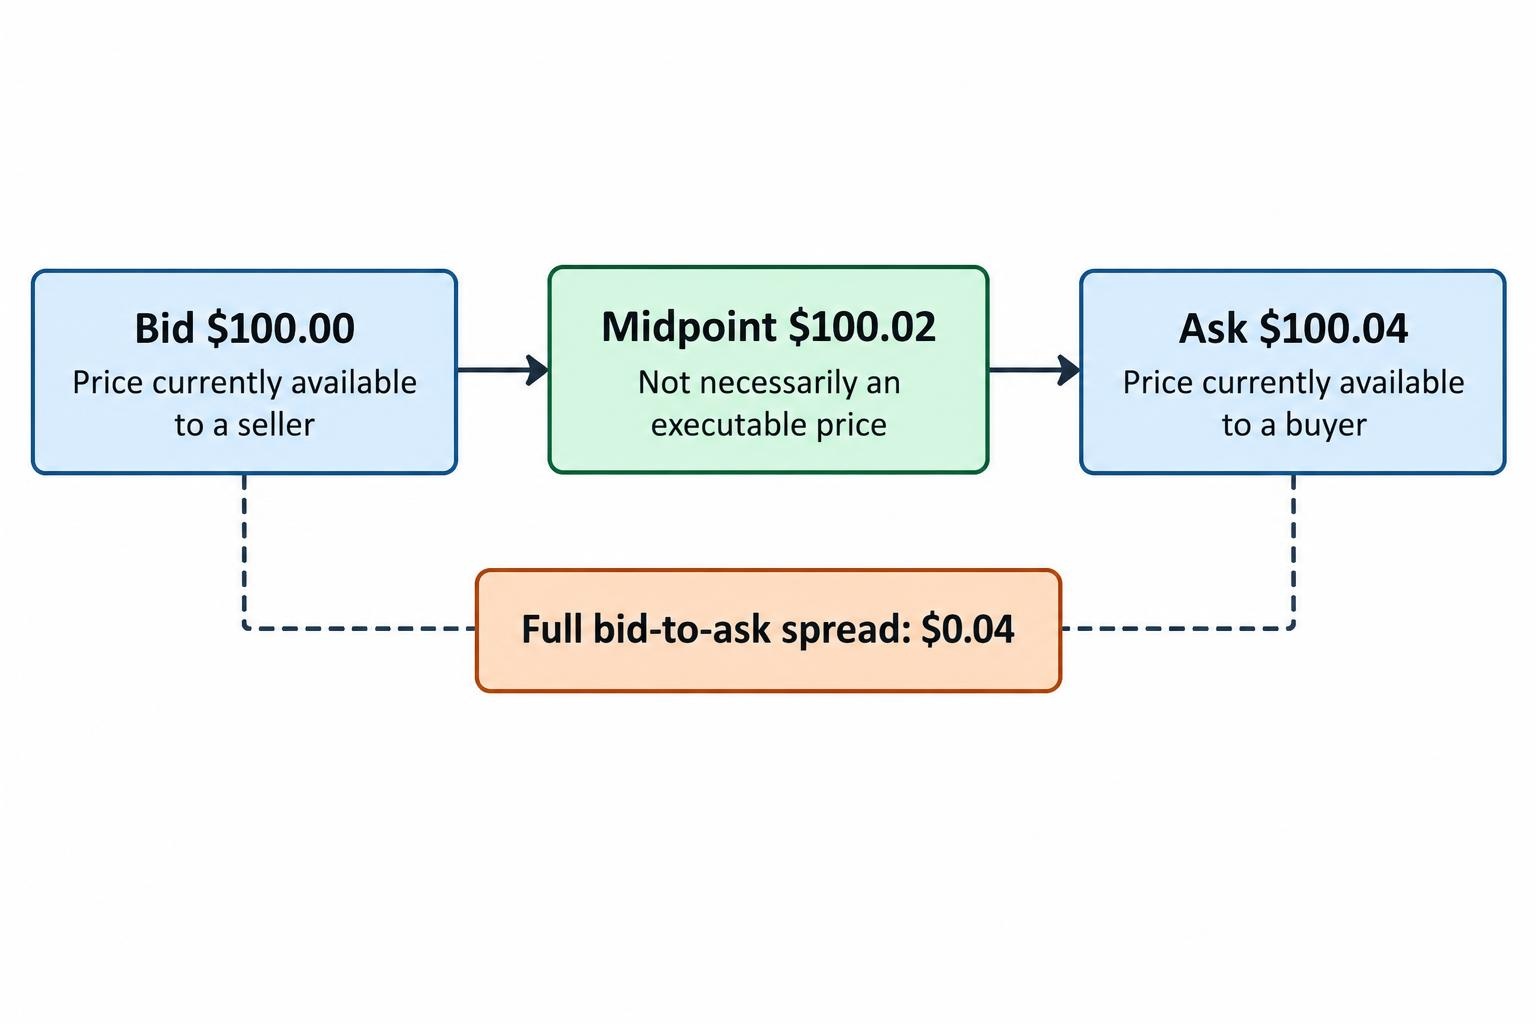
A trader opens an order ticket and sees two prices for the same instrument. One price is available to sellers. The other is available to buyers. A share might show a bid of $100.00 and an ask of $100.04. Buying immediately means paying $100.04. Selling immediately means receiving $100.00. The four cents between those prices is the spread.
This gap explains why a new position can show a loss almost as soon as it opens, even when the market appears unchanged. The trader bought at the price offered to buyers, but the position would currently be closed at the price available to sellers. A chart showing $100.02 does not remove that difference. It may simply be showing the midpoint between the two quotes.
Understanding Bids, Asks, and Quotes
An order ticket may label the two sides “sell” and “buy” from the customer’s perspective. The sell price then corresponds to the bid, and the buy price corresponds to the ask. Other screens use bid and ask directly. The labels need to be read in the context of the transaction being entered.
The bid is the price a buyer is currently offering. The ask, also called the offer, is the price a seller is currently requesting. The bid–ask spread is the ask minus the bid. In an order book, the displayed best bid is normally the highest available buying price, while the best ask is the lowest available selling price. A broker’s quote may instead represent the prices at which that broker offers to deal.
The distinction matters because a quoted market price is not always a price at which a trader can transact. The latest completed trade, the midpoint, and the current bid or ask describe different things. A platform may display one prominently and place the others inside the order ticket. Reading the quote correctly comes before assessing whether a trade is cheap, expensive, profitable, or worth taking.
Trading education resources such as DayTrading.com cover instruments and trading methods, but the same basic question applies across them: which price can the trader actually receive or pay? A strategy based on a chart needs to be translated into executable prices before its expected return can be assessed.
Context and Scope
All numerical examples in this article are hypothetical. They illustrate the mechanics rather than current market conditions or any broker’s live pricing. The discussion concerns the bid–ask spread. Traders also use “spread” to describe the difference between bond yields or a position combining two contracts. Those are separate uses of the word.
For a trader considering an ordinary purchase or sale, the spread is the distance between the two sides of the market. It affects the entry price, the exit price, and the amount of movement needed before a position produces a net gain. Its size also changes with the instrument, trading conditions, transaction size, and route used to execute the order.
How Bids and Offers Produce Trades
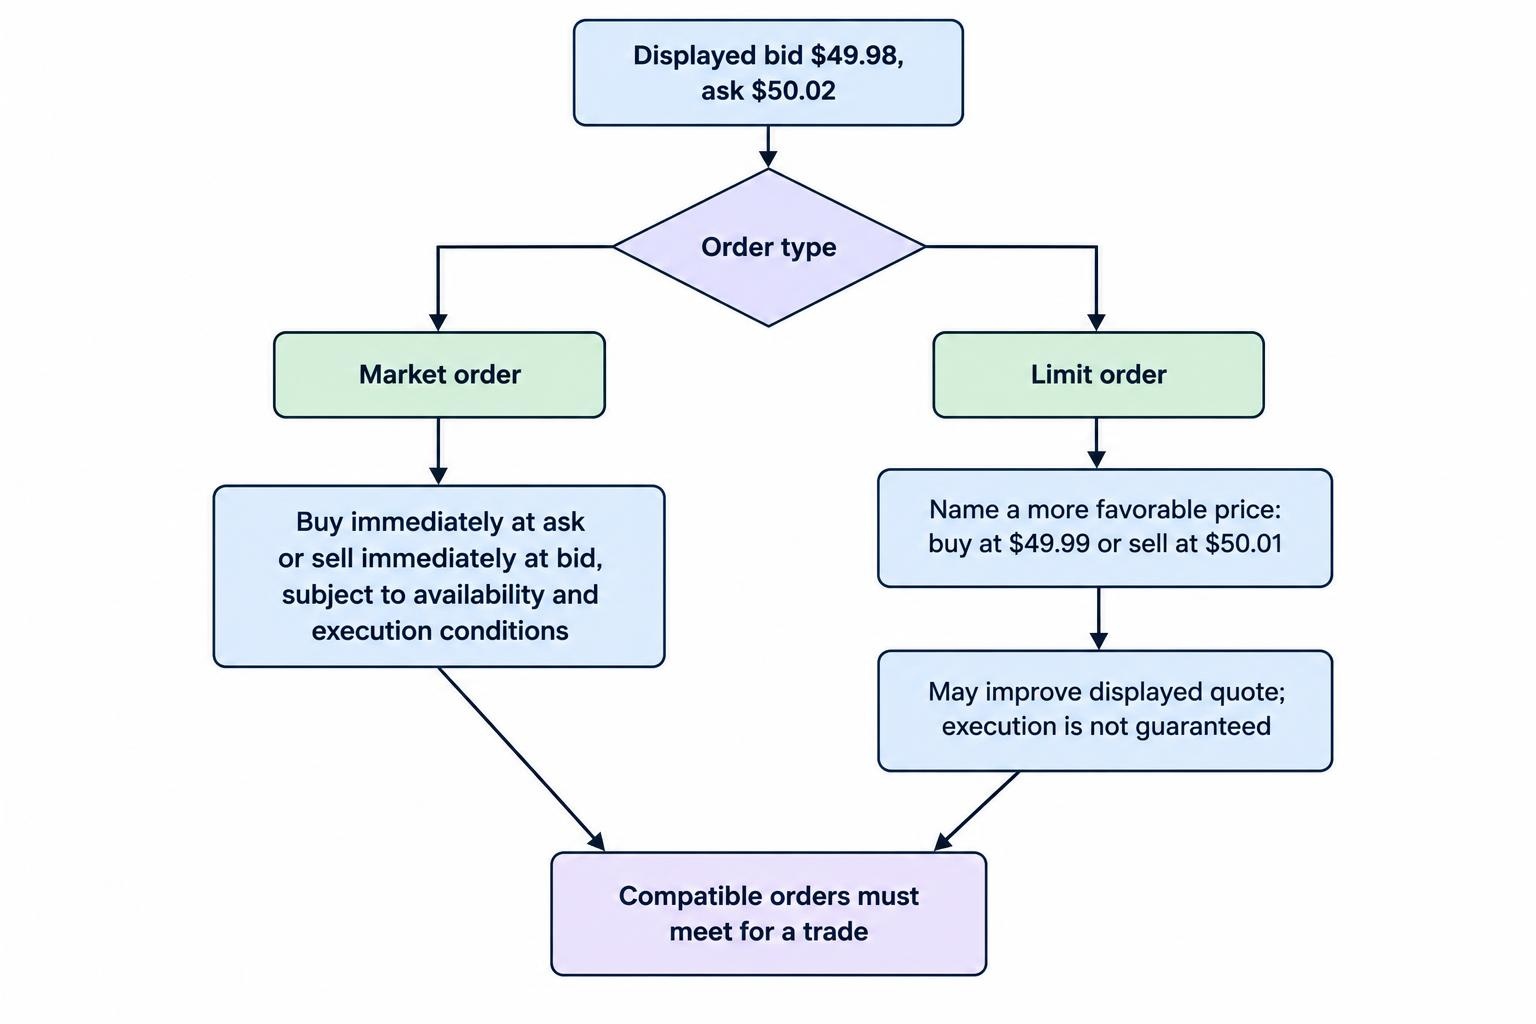
Suppose a market displays a best bid of $49.98 and a best ask of $50.02. Someone is willing to buy at $49.98, and someone is willing to sell at $50.02. They have not yet agreed on a transaction at those prices. The four cent gap remains until a participant accepts an available quote or submits an order that changes the market.
A trader who wants to buy immediately can submit a market order. Subject to availability and execution conditions, it trades against the selling interest at the ask. A trader who wants to sell immediately trades against the buying interest at the bid. This is often described as taking liquidity because the order consumes quantity that another participant has already offered.
A trader can also propose a price rather than accept one. A buy limit order at $49.99 could improve the best bid if the venue accepts it and no better bid exists. A sell limit order at $50.01 could improve the best ask. Either order would narrow the displayed spread. A transaction occurs when compatible orders meet under the venue’s matching rules.
Order Book Depth and Execution Beyond the Best Quote
These prices come with quantities. An ask of $50.02 might be available for only 100 shares. More shares could be offered at $50.03 or $50.05. The visible best price therefore does not necessarily apply to an entire order. The order book shows how much buying and selling interest is available at different price levels, although displayed quantities may change before an order reaches them.
A quote is also a snapshot. Between viewing it and submitting an order, other participants may trade, cancel orders, or replace prices. Seeing an ask on the screen does not by itself guarantee that an order sent afterwards will receive it. The execution report establishes the price actually obtained.
Consider an immediate purchase of 300 shares. If 100 shares are available at $50.02 and another 200 at $50.04, the average purchase price is approximately $50.0333. The trader did not buy all 300 shares at the best ask. The larger order reached another level of the book, adding a cost beyond the gap visible in the initial quote.
This distinction separates the quoted spread from the cost of executing a particular order. A narrow spread with little quantity available can be expensive for a larger trader. A slightly wider spread with substantial quantity on both sides may produce a more predictable execution. Price and available size need to be read together.
Short Positions and the Realities of Providing Liquidity
The same entry and exit mechanics apply to short positions. A trader selling short immediately generally sells at the bid. Buying back to close the position generally occurs at the ask. If the quote remains unchanged, the difference is a loss for the short seller, just as it is for a buyer who immediately resells.
Limit orders can reduce that cost, but they do not automatically earn the spread. An order resting at the bid may never receive a fill. Other orders can be ahead of it in the queue, or the market can rise before sellers reach its price. An order that does receive a fill may do so because new information has made the price less attractive.
For example, a trader leaves a buy order at $49.98 while the ask is $50.02. The order fills just as the market reprices to $49.80. Buying below the previous ask did not prevent a loss. The trader supplied liquidity at a price that became unfavourable. This is one reason providing liquidity involves risk rather than a dependable payment for waiting.
Dealers and market makers face similar choices when they quote both sides. They can buy from one participant and sell to another, potentially earning part of the spread. They may also hold inventory, hedge it elsewhere, or trade with participants who have better information. The quoted gap is not identical to their eventual profit.
For the ordinary trader, the practical result is straightforward. Immediate execution usually requires accepting the available opposite quote. Naming a more favourable price exchanges some control over execution for control over price. Neither choice changes the need to identify the bid, the ask, and the quantity available before estimating the cost of the transaction.
Measuring the Spread and Its Monetary Cost
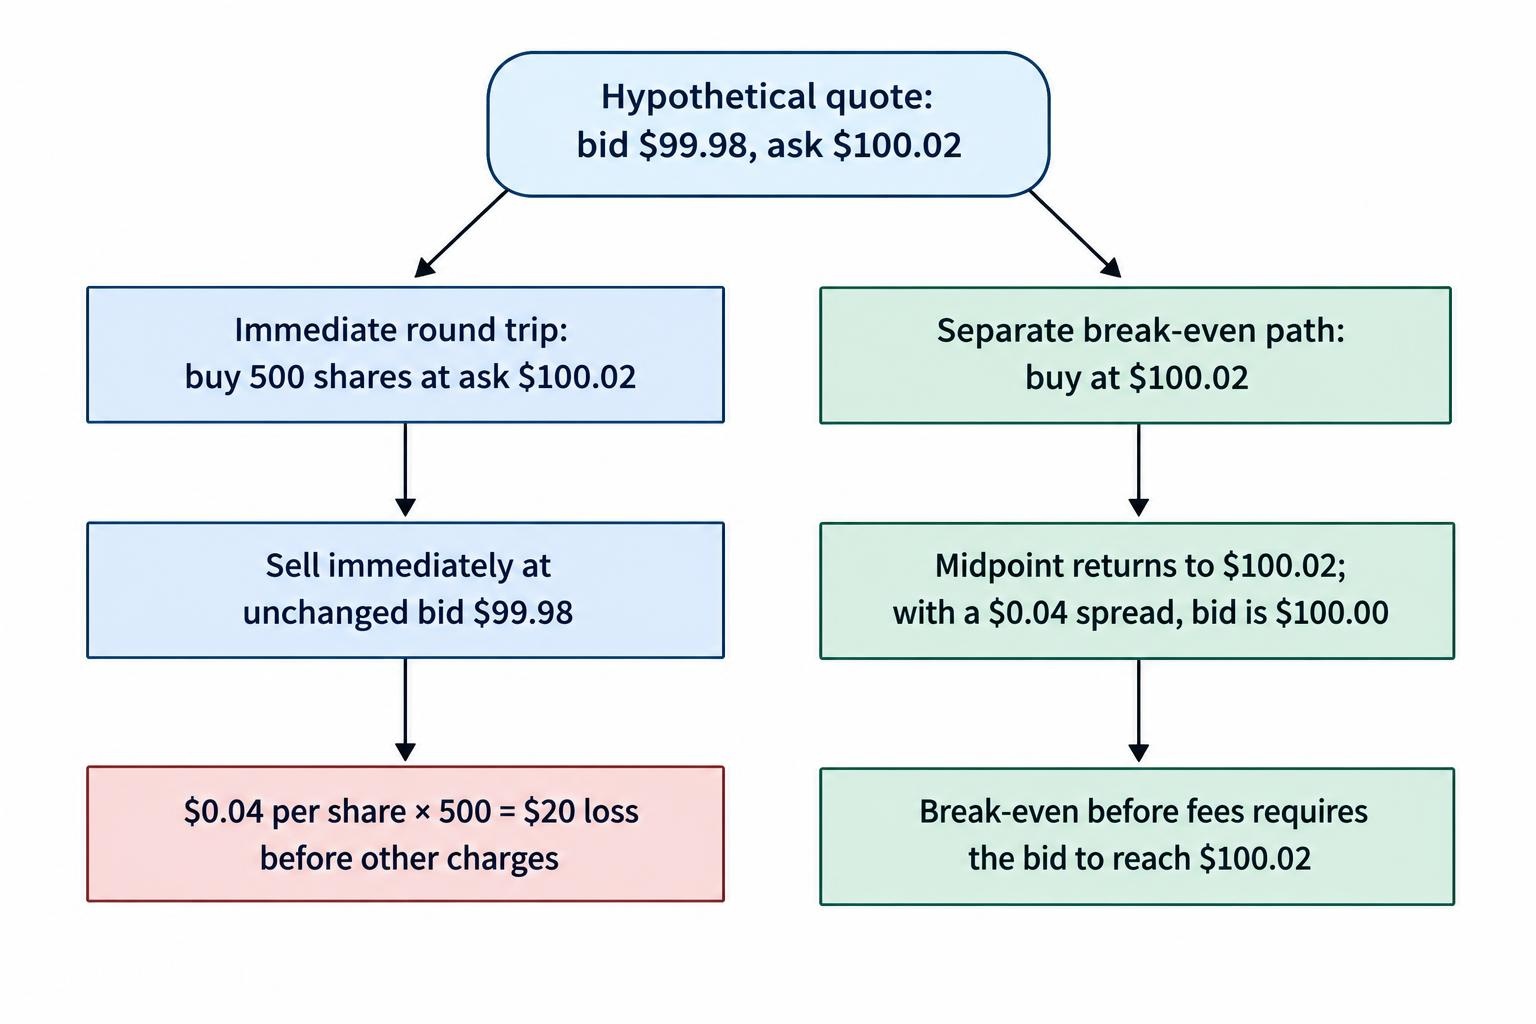
The simplest measure of a spread is the price difference. A bid of $99.98 and an ask of $100.02 produce a spread of $0.04. Buying 500 shares at the ask and immediately selling them at the unchanged bid produces a $20 loss before commissions or other charges. The calculation is four cents multiplied by 500 shares.
That immediate round trip costs one full spread, not two full spreads. Relative to the $100.00 midpoint, the purchase is two cents higher and the sale is two cents lower. Those two half spreads add to four cents. Counting four cents at entry and another four cents at exit would double the cost in this example.
If the market subsequently rises, the same distinction remains. Buying at $100.02 and later selling at $100.98, with the quote then at $100.98 and $101.02, produces a $0.96 gain per share. The midpoint rose by $1.00. The four cent difference between that movement and the realised gain reflects crossing the spread across the two transactions.
Entry and exit spreads need not match. When measuring transactions against their respective midpoints, a purchase at the ask costs half the entry spread, and a sale at the bid costs half the exit spread. This assumes execution exactly at the quotes and symmetric distances around each midpoint. Commissions, price improvement, and execution beyond the best quote alter the result.
Breaking even requires the closing price to cover the entry price and applicable charges. After buying at $100.02, a trader does not break even simply because the midpoint returns to $100.02. With a four cent spread, the bid would still be $100.00. Before fees, the bid must reach $100.02, corresponding to a midpoint of $100.04 if the spread remains unchanged.
Relative Spreads, Pips, Ticks, and Leverage
Absolute differences are less useful when comparing instruments at very different prices. A four cent spread on a $100 instrument is 0.04% of the midpoint, or four basis points. A four cent spread on a $2 instrument is 2%. The dollar gap is identical, but the movement required to overcome it is much larger relative to the cheaper instrument’s price.
Foreign exchange traders commonly express spreads in pips. For EUR/USD, a quote of 1.1000 and 1.1002 has a two pip spread, using a pip of 0.0001. A position of 100,000 euros has an immediate spread cost of $20 because the exchange rate difference is quoted in dollars per euro. Smaller positions reduce that amount proportionally.
The frequently repeated figure of $10 per pip applies to that position size and quotation arrangement. It is not a universal pip value. Other currency pairs, position sizes, and account currencies require different calculations or currency conversion. Many yen pairs use 0.01 as a pip, and a platform may show fractional pips as additional decimal places.
Futures traders often measure spreads in ticks. Suppose a contract has a minimum price increment of 0.25 and a value of $50 for each full point. One tick is worth $12.50 per contract. A one tick spread would therefore cost $12.50 for an immediate round trip in one contract at unchanged quotes. Contract specifications determine the conversion.
Position size matters more than the number shown on the price screen. A spread of two basis points on $100,000 of exposure represents $20. If the trader has posted $1,000 of margin, that remains a $20 transaction cost, equivalent to 2% of the posted amount. Margin changes the capital supporting the position, not the spread charged on the same exposure.
Spread calculations also need to remain separate from financing and fees. A commission is an explicit transaction charge. Overnight financing relates to holding a position under the product’s terms. Exchange fees and currency conversion charges can add further costs. The spread describes the price gap, and a complete cost estimate adds the other applicable charges without counting the same expense twice.
Why Spreads Widen and Narrow
After measuring a spread, the next question is why it has that size. Prices emerge from participants’ willingness to transact, the quantity they will commit, and the risks they face while quoting. A spread changes when those conditions change. It is not a fixed property of an instrument simply because its name and underlying market remain the same.
Competition can narrow the gap. When several participants want to buy, a higher bid can move ahead of existing orders. Sellers can compete by lowering their asks. A market with frequent trading and substantial interest on both sides can support close quotes because participants have more opportunities to transact or adjust their positions.
Liquidity includes more than trading volume. It concerns how easily a trader can execute a desired amount without moving the price substantially. A busy market may still have little quantity at its best quotes. A market can also show a narrow spread briefly while offering insufficient depth for a larger order. Volume, spread, and depth describe related but different conditions.
The minimum price increment places another constraint on the visible gap. If a venue permits quotes only in one cent steps, a normally uncrossed market cannot show a half cent difference between its best displayed bid and ask. Competition may then appear through greater quantity, queue position, or other execution arrangements rather than a further reduction in the quoted spread.
Uncertainty, Events, and Volatility
Uncertainty can push quotes apart. A participant offering to sell risks doing so just before prices rise. A participant offering to buy risks acquiring an instrument just before prices fall. If incoming information makes those outcomes more likely, quoting close to the midpoint becomes less attractive. Participants may widen their prices, reduce the quantity offered, or withdraw orders.
An economic announcement illustrates this process. Before the release, existing quotes reflect expectations about the data. Once the figures arrive, participants reassess value and react at different speeds. Older quotes may be cancelled while new prices are submitted. A trader can encounter both a wider gap and less available quantity during that transition.
Volatility and spread width are therefore connected, but the relationship is not mechanical. A volatile market with substantial competing interest may continue to offer tight quotes. A quieter market can have a wide spread because few participants are active. Observing price movement alone does not establish what execution will cost.
Inventory, Hedging, and Trading Hours
Inventory also affects quoting. A dealer holding more of an instrument than desired may adjust prices to encourage buyers and discourage additional sellers. Another dealer with the opposite inventory may quote differently. These adjustments can move the bid and ask unevenly. They do not require a matching change in the instrument’s estimated fundamental value.
Hedging costs can feed into the spread as well. A participant quoting an option may need to trade the underlying instrument to manage risk. If that underlying market becomes harder or more expensive to trade, maintaining a close option quote may become less attractive. The spread can reflect conditions in related markets as well as activity in the instrument itself.
Trading sessions influence who is available to transact. Around openings, closings, holidays, or periods with fewer active participants, quotes may differ from those during the most active part of the session. The pattern depends on the market and venue. A trader should not assume that a spread observed at one time represents the cost throughout the day.
A wider spread can affect an existing position even when the midpoint does not change. Suppose the quote moves from $99.99 and $100.01 to $99.90 and $100.10. The midpoint remains $100.00. A long position valued at the available selling price now shows a lower exit value, while a short position valued at the buying price shows a higher closing cost.
This change is economically relevant because the trader currently needs to cross a larger gap to close. It does not necessarily mean that an equivalent transaction has occurred at either new quote. Platforms may value positions using different conventions, so the displayed profit or loss needs to be interpreted alongside the actual closing price available for the position’s size.
When trading conditions improve, competition and available quantity can bring the sides closer again. There is no guarantee that a trader’s preferred spread will return before an order must be executed. The useful approach is to treat width as an observable condition at the time of the decision, rather than a permanent promise about future transaction costs.
How Spreads Differ Across Markets
The bid and ask have the same basic meaning across markets, but the way they are produced differs. In shares traded through an exchange order book, quotes arise from buying and selling orders on that venue. Brokers may route orders among venues or other execution arrangements. The price displayed on one screen does not necessarily describe every available source of execution.
An actively traded share often has a narrower spread than a thinly traded share, although price level and minimum increments affect comparisons. Exchange traded funds add another consideration: liquidity in their underlying assets. Trading activity in the fund’s own shares is relevant, but it is not the only factor influencing how participants price and hedge transactions.
Options and Futures Contracts
Listed options require attention to the individual contract. Two options on the same share can have different spreads because their strikes, expiries, prices, and trading interest differ. A ten cent spread is also a different percentage cost on an option priced near $0.50 than on one priced near $10.00. A liquid underlying share does not guarantee that every option series has close quotes.
Options quotations also need to be converted into the contract’s cash value. If an option represents 100 shares, a ten cent gap means $10 per contract. The trader should check the multiplier rather than treating the displayed premium difference as the entire monetary cost.
Futures trade under contract specifications that define increments, values, and other terms. Spread width can be compared in ticks, but its monetary effect depends on the contract and number traded. Different expiries can have different activity. The contract with the most familiar underlying asset is not automatically the contract with the best execution conditions at every maturity.
Forex, CFDs, Crypto, and Binary Options
Retail foreign exchange commonly involves quotes supplied through a broker rather than a single central exchange order book. Providers may combine prices from liquidity sources and apply their own pricing arrangements. Two brokers can therefore show different spreads on the same currency pair at the same moment. Comparing them requires matching the account type, transaction size, and relevant trading conditions.
Contracts for difference use prices offered under the provider’s dealing terms. Depending on the market and account, costs may appear in the spread, a commission, or both. The spread on a CFD need not equal the spread on the underlying exchange instrument. Price feeds, hedging arrangements, and the provider’s charges can all contribute to the difference.
Cryptocurrency trading adds venue fragmentation. The same asset can have different quotes and available quantities on different exchanges. A close spread on one venue does not mean that a larger order will execute cheaply there. Trading fees, the account’s fee tier, and the currency or stablecoin used in the pair also affect the transaction’s economics.
Binary options require a distinction between product models. Educational coverage at BinaryOptions.net concerns products whose payouts depend on a defined outcome. A fixed return, fixed stake contract may present a payout percentage rather than an ordinary tradable bid and ask. Exchange traded binary contracts can have buying and selling quotes and a spread between them.
The absence of a conventional spread in a fixed payout ticket does not establish that the product has no economic cost. The payout relative to the amount risked, any fees, and the contract’s settlement rules determine the economics. Applying a forex pip calculation to that arrangement would miss how the product works.
Across these markets, the useful comparison is the amount paid to obtain and later close the intended exposure. A percentage, pip, tick, or quoted payout is only a starting description. The trader needs the product’s transaction rules and monetary values before deciding whether two apparently similar prices represent similar costs.
How Orders Interact With the Spread
A trader who understands the quote still needs to decide how to enter it. Market orders prioritise execution at available prices. Buy orders generally reach the ask, and sell orders generally reach the bid. The last traded price shown on a chart is not a promise of the next execution price, particularly when quotes are moving or available quantity is small.
A marketable limit order can place a boundary on the price while still seeking immediate execution. With an ask of $100.02, a buy limit of $100.03 permits purchases at $100.03 or better. It may execute at $100.02, but if the available offers move above the limit before execution, the remaining order will not buy at the higher prices.
A less aggressive buy limit, such as $100.00, waits for sellers willing to accept that price. It may receive price improvement relative to the earlier ask, but it may receive no execution. A trade idea can be correct about market direction while a resting order misses the move. The spread saving then has to be considered alongside the missed transaction.
Partial fills create another issue. A trader may receive some quantity at the desired limit while the remainder stays unfilled. The resulting position is smaller than planned. Replacing the remainder with a market order may cross a different spread later. Execution records should therefore reflect the actual filled quantities and prices rather than the original order’s intended size.
Slippage, Execution Records, and Stop Orders
Slippage describes a difference between an expected or reference price and the eventual execution price. It can arise as prices change during order handling, or when an order consumes several levels of available quantity. The reference needs to be stated. Measuring a purchase against the midpoint includes spread crossing, while measuring it against the initial ask isolates a different part of execution cost.
Without that distinction, a trader can report the spread and slippage separately while counting some of the same price difference twice. A purchase at $100.04 against an initial quote of $99.98 and $100.02 is four cents above the midpoint, but only two cents above the ask. Both descriptions are valid if their reference prices are clear.
Stop orders also depend on the platform’s trigger rules. A stop might be triggered by a bid, ask, last trade, or another defined reference. The applicable rule belongs to the product and execution arrangement. A chart based on one price can therefore look inconsistent with a stop triggered by another.
Suppose a platform triggers a long position’s stop using the bid. The normal quote is $99.99 and $100.01, and the stop is at $99.95. If the quote widens to $99.90 and $100.10 while the midpoint stays at $100.00, the bid has passed the stop. A midpoint chart alone would not show the reason for the trigger.
For a short position whose stop uses the ask, widening on the offer side can have the corresponding effect. This does not make every stop execution correct or explain every discrepancy. It shows why the relevant quote and the order’s stated conditions need to be checked before drawing conclusions from a chart.
A conventional stop order that becomes a market order does not guarantee execution at the stop price. A gap or thin order book can produce a worse fill. A stop limit order imposes a price boundary but may remain unfilled after being triggered. The difference concerns execution risk as well as spread cost.
Choosing an order type therefore requires a decision about price, timing, and acceptable uncertainty. The smallest theoretical spread cost is not necessarily the best outcome if the position cannot be opened or closed when needed. Conversely, urgency does not remove the value of checking the available quote and quantity before sending an order.
Comparing Broker Pricing
Once the trader can interpret the market and the order, broker pricing becomes easier to compare. A headline spread describes only one part of the arrangement. An account advertising a very low minimum may reach that figure briefly, on a particular instrument, or under certain conditions. It does not establish the price the trader will usually receive.
An average spread is more informative only when its calculation matches the intended use. An average across every hour of a day differs from an average during the trader’s session. An average quoted spread also differs from the cost observed when actual orders are filled. The sampling period, market conditions, and instruments included can materially change the number.
Comparisons made through resources such as BrokerListings.com need to be taken back to the account’s own pricing terms. The relevant question is what the trader pays for the same instrument, size, and order type under comparable conditions. A broker name or account label is not a substitute for that calculation.
Raw Spreads, Commissions, and Account Types
Some accounts recover transaction charges mainly through wider quotes. Others advertise a tighter spread and charge commission separately. Descriptions such as “raw spread” do not mean that the complete transaction is free. Commission may apply per side, per contract, as a percentage of traded value, or subject to a minimum charge.
Consider two hypothetical foreign exchange accounts trading 100,000 euros against dollars. Account A has a 1.2 pip spread and no separate commission. Crossing that unchanged spread for an immediate round trip costs $12. Account B has a 0.2 pip spread and charges $3 at entry and $3 at exit. Its combined cost is $8 under those assumptions.
Account B has the lower illustrated cost, but the comparison changes if its actual spreads, commissions, or execution differ. A trader using another currency pair or a smaller position may face different values. Minimum commissions can make a pricing arrangement less attractive for small trades even when its advertised spread looks favourable.
Fixed spread accounts require a different reading of the terms. A fixed quotation can make routine cost estimates easier, but the agreement may contain conditions covering unusual markets, trading hours, order handling, or availability. The word “fixed” should be assessed against those terms rather than assumed to guarantee any transaction size at any moment.
A variable spread reflects changing quotes. Its cost may be low during active trading and higher when participation falls or uncertainty rises. This variability matters for strategies that must enter at particular times, especially around events. An inexpensive average is less useful when the strategy repeatedly trades during the expensive part of the distribution.
Execution Quality and Incidental Charges
Execution quality can outweigh a small advertised difference. A tighter displayed spread offers little benefit if larger orders regularly execute beyond the best quote. Price improvement can work in the other direction. Rejections, partial fills, and delays also affect whether the trader receives the exposure intended by the strategy.
Other charges belong in the comparison when the proposed trading behaviour incurs them. Overnight financing matters to a position held across the provider’s financing time. Currency conversion matters when profits, losses, or purchases require conversion. Those charges should be calculated under their own rules, rather than presented as part of the quoted spread.
The resulting comparison is a monetary estimate for an actual trading pattern. It connects the broker’s stated charges to the trader’s position sizes, instruments, execution needs, and holding periods. Checking observed fills against that estimate then shows whether the account is delivering the cost assumed in the strategy.
Applying Spread Costs to a Trading Strategy
The spread becomes most relevant when it is compared with the movement a strategy expects to capture. A four cent transaction cost is a large share of a ten cent target and a small share of a two dollar target. The cost itself has not changed. Its effect on the proposed trade has changed because the expected gross return is different.
This is why frequent trading needs careful cost accounting. A trader paying $12 in spread and commission per completed trade would pay $480 across 40 comparable trades. That amount is incurred whether the market calls are good or poor. A method with a modest gross advantage can lose it through repeated transaction costs.
Longer holding periods can reduce the spread’s proportion of a larger price move, but they do not remove the initial and eventual execution cost. They can also introduce financing and exposure to overnight price changes. Holding a weak trade longer simply to make its spread look smaller does not improve the trade’s underlying economics.
A cheap spread does not supply a reason to trade. It reduces an obstacle to earning returns, but the strategy needs an expectation about price movement. Transaction cost and trading advantage belong to the assessment.
Win Rates, Expectancy, and Backtesting Assumptions
Costs also alter the winning percentage needed to break even. Suppose a strategy’s gross winning trade earns $20 and its gross losing trade loses $10. Ignoring costs, it breaks even at a winning rate of one third. If each completed trade costs $2, the net winner earns $18 and the net loser loses $12. The required winning rate rises to 40%.
That calculation assumes constant outcomes and costs. Actual results vary, but the example shows why assessing only the gross reward relative to the stop distance can overstate a strategy’s margin for error. Spread, fees, and execution affect both profitable trades and losing trades. They need to appear in the same calculation.
Backtests require consistent price assumptions. A simulation using midpoint prices for both purchases and sales usually needs an allowance for crossing the spread. A simulation using executable asks for purchases and bids for sales already includes that component. Subtracting another full spread from those same transactions would understate the simulated result.
Historical last trade prices need their own interpretation because they do not reveal the complete quote available for every simulated order. A fixed spread assumption may be adequate for a rough calculation, but it can miss periods when the strategy trades into wider markets. Testing a method around announcements using calm session costs can produce misleading estimates.
Live Records, Realised Results, and Position Sizing
Live records provide a more direct check. The trader can record the bid, ask, intended quantity, filled quantity, actual execution price, and explicit charges around each transaction. Those observations help distinguish a costly quoted market from additional execution costs. A whole day’s average spread does not necessarily describe the conditions encountered by the strategy.
Realised profit and loss calculated from actual entry and exit fills already reflects the prices paid and received. The spread should not be deducted again from that result. Separate cost analysis can explain why realised returns differ from an idealised model, but it must use consistent reference prices to avoid inventing another expense.
Position sizing then turns the observed cost into a cash amount. A trader can ask whether the expected movement leaves enough room after spread and fees, whether the order is large enough to reach further price levels, and whether the intended exit remains workable in less favourable conditions. These questions connect the quote to the trade being considered.
The decision rests on executable prices rather than the apparent simplicity of a chart. A bid and ask describe what is currently available on each side, subject to quantity and execution conditions. Reading those prices, converting their difference into money, and checking actual fills gives the trader a usable measure of the cost of participating in that market.